Simulations of dissolved oxygen concentration in CMIP5 Earth system models
组内消息 2017-01-17

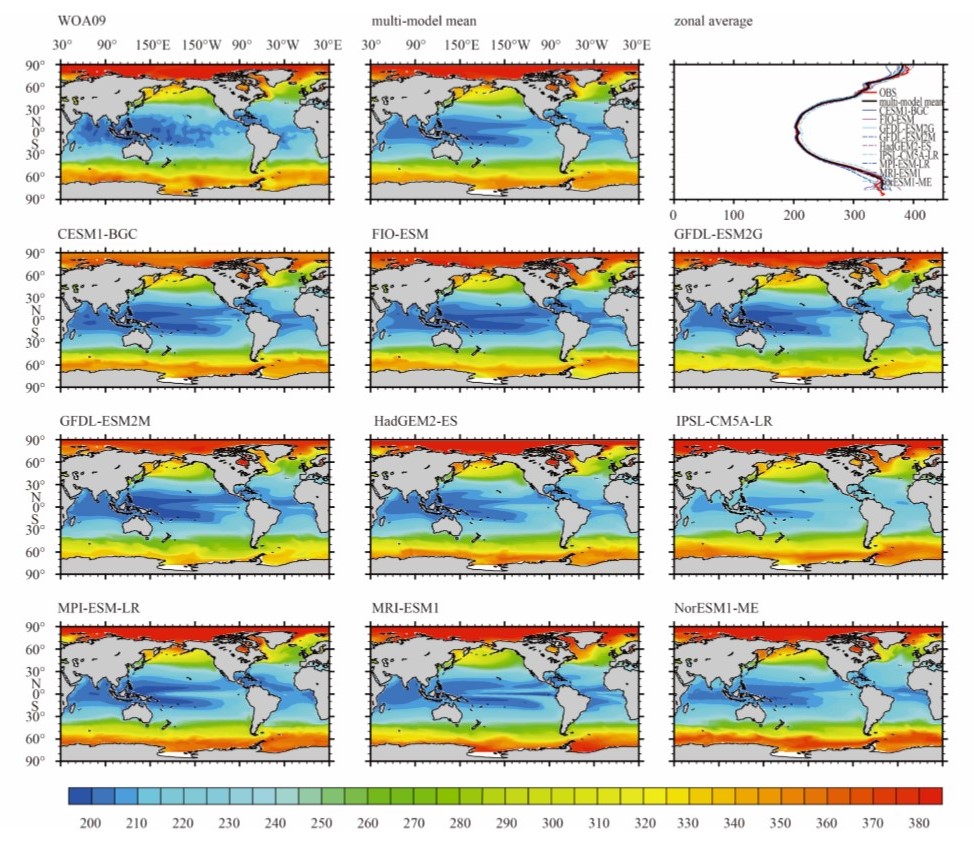
Observation and model-simulated annual mean dissolved oxygen at the sea surface, with the zonal mean in the top-right panel. The observation is from the WOA09 dataset. Model simulations are from CMIP5 “esmHistorical” experiment of nine ESMs, each averaged from 1981 to 2005. Multi-model mean shows the average of all nine models.
The climatologies of dissolved oxygen concentration in the ocean simulated by nine Earth system models (ESMs) from the historical emission driven experiment of CMIP5 (Phase 5 of the Climate Model Intercomparison Project) are quantitatively evaluated by comparing the simulated oxygen to the WOA09 observation based on common statistical metrics. At the sea surface, distribution of dissolved oxygen is well simulated by all nine ESMs due to well-simulated sea surface temperature (SST), with both globally-averaged error and root mean square error (RMSE) close to zero, and both correlation coefficients and normalized standard deviation close to 1. However, the model performance differs from each other at the intermediate depth and deep ocean where important water masses exist. At the depth of 500 to 1 000 m where the oxygen minimum zones (OMZs) exist, all ESMs show a maximum of globally-averaged error and RMSE, and a minimum of the spatial correlation coefficient. In the ocean interior, the reason for model biases is complicated, and both the meridional overturning circulation (MOC) and the particulate organic carbon flux contribute to the biases of dissolved oxygen distribution. Analysis results show the physical bias contributes more. Simulation bias of important water masses such as North Atlantic Deep Water (NADW), Antarctic Bottom Water (AABW) and North Pacific Intermediate Water (NPIW) indicated by distributions of MOCs greatly affects the distributions of oxygen in north Atlantic, Southern Ocean and north Pacific, respectively. Although the model simulations of oxygen differ greatly from each other in the ocean interior, the multi-model mean shows a better agreement with the observation.
本文基于常用的统计方法,通过与WOA09观测的海洋溶解氧浓度数据进行比较,定量地评估了9个CMIP5地球系统模式在历史排放试验中海洋溶解氧气候态特征的模拟能力。在海表,由于地球系统模式均能很好地模拟海表温度(SST),模式模拟的海表溶解氧浓度分布与观测一致,模拟结果无论是全球平均浓度偏差还是均方根误差均接近0,空间相关系数与标准偏差接近1。在海洋中层以及深层这些重要水团所在的区域,各模式的模拟能力则差异较大,尤其在溶解氧低值区(OMZs)所在的500m到1000m,各模式均出现全球平均偏差、均方根误差的极大值以及空间相关系数的极小值。在海洋内部,模式偏差的原因比较复杂。经向翻转环流和颗粒有机碳通量均对模式的偏差有贡献。分析结果表明物理场偏差对溶解氧偏差的贡献较大。一些重要水团,比如北大西洋深水,南极底层水以及北太平洋中层水在极大程度上影响了溶解氧在这些海区的分布。需要指出的是,虽然在海洋内部各模式模拟的溶解氧浓度偏差较大,但是多模式平均结果却能表现出与观测较好的一致性。
Bao Ying, Li Yangchun. 2016. Simulations of dissolved oxygen concentration in CMIP5 Earth system models. Acta Oceanologica Sinica, 35(12): 28–37, doi: 10.1007/s13131-016-0959-x


